


E-Archive
Science Update
in Vol. 20 - May Issue - Year 2019
Application Of Grey Relational Analysis For The Optimisation Of The Shot Peening Parameters With Multiple Performance Characteristics
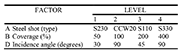
Table 1. Shot peen factors and their levels
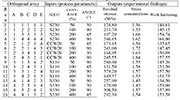
Table 2. Fractional factorial array L16(45) with inputs and outputs
(1)
(2)
(3)
(4)
(5)
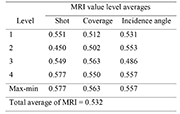
Table 4. Response table for grey relational grade
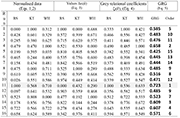
Table 3. Grey relational coefficients and grey relational grade for three different performance characteristics
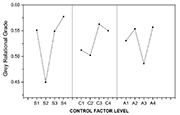
Fig. 1. Response graph for the GRG
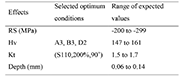
Table 5. Estimated optimum peening conditions
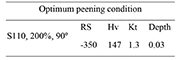
Table 6. Experimental peened effects determined from the estimated peening conditions of table 6
Introduction
The shot peening process causes the surface of metallic components to be strengthened through bombardment with a torrent of minute balls named shots, thus inducing significative responses such as compressive residual stresses, surface hardening and surface roughness. In the aerospace, automotive, shipping and manufacturing industries, proper selection and control of peening factors is highly required to ensure a real benefit mainly in terms of fatigue resistance. In present research, grey-fuzzy methodology is used for determining the best selection of the control factors that directly influence the multi-objective response properties of a peened 2024-T351 aluminium alloy (AA). The input parameters taken into consideration are shot, coverage and incidence angle. For statistical purposes, the experimental parameters were put in place with a L16 orthogonal fractional array. The three properties extracted experimentally are optimised. The three multi-objectives are converted into a single object with the help of grey relational analysis (GRA). The confirmation test carried out to validate the results established that the approach used in this work can effectively provide the optimum parameters by virtue of obtaining an improvement in fatigue resistance.
Design Of Experiments Through Grey-relational Method
The basic steps involved in any design of experimental analysis consist of assuming a set of variables controlling the output function, selecting the number of levels of each variable to test, and picking the proper factorial array. Even though the choice of a particular approach will depend on the number of factors and levels, the use of the fractional factorial method (also known as the orthogonal array) represents itself as the most reasonable choice in terms of reducing the number of experiments without loss of quality in the obtained results [1]. A total of three factors were evaluated at four levels without interaction, each as shown in Table 1. These chosen factors are of fundamental importance to the aircraft industry [2].
A fractional factorial L16(45) array was the choice to enable the optimisation of five parameters with each of these set at a maximum of four levels. This approach permitted the estimation of all main and first-order factor interactions. The full fractional factorial array along with the selected factors and levels and the experimental values is depicted in Table 2.
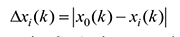
As can be seen, it is difficult to make comparisons between the different kinds of factors because they exert a different influence. To redress the situation, there is a need of a standardized transformation of such factors. When dealing with information that is either incomplete or undetermined, the so-called grey relational analysis (GRA) becomes quite useful. This is a method by which the relational degree of every factor in the system can be analysed. GRA uses information from the grey system to dynamically compare each influencinge factor quantitatively. This approach is based on the level of similarity and variability among all factors to establish their relationships [3]. In this method, a grey relational grade is obtained by analysing the relational degree of the multiple responses. The grey relational coefficient of each output response of residual stress, roughness and work hardening is calculated. Grey relational analysis is based on minimization of the maximum distance between an objective sequence (a collection of measurements) and a reference sequence (target value) in the grey system. The relationship between these two sequences can be called the grey relational coefficient. For normalization of the raw sequence between 0 and 1 (since different sequences have different measurement units and scales), The type of normalization depends upon the characteristic that is desired out of the raw sequence:
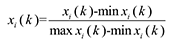
For the larger-the-better characteristic: (1)
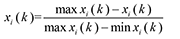
For the smaller-the-better characteristic: (2)
Where xi(k) is the value after grey relational generation while min xi(k) and max xi(k) are the smallest and largest values of xi(k) for the kth response.
For compressive residual stresses (RS) and work hardening (WH) larger-the-better and surface roughness (KT) the smaller-the-better characteristics were selected (Table 3).
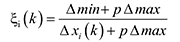
The absolute difference of the compared series and the referential series should be obtained by using: (3)
In the GRA, the grey relational coefficient can be expressed as follows: (4)
In equation (4), the term p is the distinguishing coefficient which is used to adjust the difference of the relational coefficient, usually p [3]. The lower the value of p, the higher is the distinguishing ability. If p is taken to be 0.5, the outcomes will hold moderate distinguishing effects and good stability.
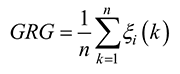
After the grey relational coefficient is derived, the average value of the gray relational coefficient is taken as the grey relational grade (GRG), see Table 3. Mathematically speaking: (5)
Table 3 shows the grey relational coefficients for all the three peening properties and the grey relational grade along with its order. The highest value of grey relational grade 0.723 indicates that experiment number 11 is the optimum combination of peening parameters in order to produce the maximum residual stresses and work-hardening with the minimum of stress concentrations. The grey relational coefficient of the first property is unity, indicating an exact reference value. However, the same reference value was not determined for the other properties for the experiment number 11. Therefore, a grey relational grade is necessary to obtain the optimum parameters for generating stress concentration with minimum damage and work-hardening with maximum performance (as shown in the last column of Table 3). Table 4 shows the response table for grey relational grade. This is obtained by calculating the average value of each input peening parameter at its corresponding level. The max-min column indicates that shot is the most significant factor among the three input variables. In order to produce the best output, the optimal combination of the parameters as calculated from the response table depicts that shot must be maintained at level 4, coverage at level 3 and incidence angle at level 4.
Fig. 1 depicts the response graph plotted for the calculated GRG. The slope of the lines in the plot is found to be more for the shot, indicated as the most influential parameter. In this plot, S1, S2, S3, S4 in the x-axis corresponds to that of the four levels of the shot. Similarly, the letters C1..C4 and A1..A4 correspond to the four levels of coverage and incidence angle, respectively.
The resultant conditions of experiment 11 from the designed experiment are shown in Table 5.
Experimentally determined peening effects using estimated optimal combinations are shown in Table 6. The experimental data were found to be slightly different from those of Table 5. Such discrepancies can be attributed to several process factors such as: (i) variation in the pressure, (ii) wear (of the media, nozzle, and hose), (iii) highly scattered shot size, (iv) variation in the flow rate due to interferences caused by dust, debris or other objects, among others.
Final Remarks
Based upon the experimental and numerical results, the following conclusions can be drawn:
The plethora of variables capable of altering the peening process, and hence fatigue life, is the reason that strict process control of all variables is necessary. The aluminium alloy 2024-T351 peened to calculated optimum conditions (S110, 200%, 90º) exhibited superior performance than when peened to initial conditions. Surface integrity degradation precedes fatigue damage. The geometry of the indentation is a prime damage feature. The advantages of the grey relational analysis approach compared to classical methods lay on speed, simplicity, and low cost; therefore, this approach can be considered for applications in engineering situations, as shot peening, laser peening, burnishing and water peening, etc. However, given the degree of uncertainty observed in the response table, integrated grey relational analysis with adaptive neural fuzzy integrated system has to be used to optimise the shot peening process parameters.
References
1. Van Nostrand, Richard Craig. (2002). Design of Experiments Using the Taguchi Approach: 16 Steps to Product and Process Improvement. Technometrics, 44, 289-289.
2. Nam, Yong-Seog, Jeon, Ung, Yoon, Hee-Kweon, Shin, Byung-Cheol, & Byun, Jai-Hyun. (2016). Use of response surface methodology for shot peening process optimization of an aircraft structural part. The International Journal of Advanced Manufacturing Technology, 87, 2967-2981.
3. L. Deng, "The introduction of grey system," The Journal of Grey System, vol. 1, no. 1, pp. 1-24, 1982.
4. Chandrasekaran, M., Muralidhar, M., Krishna, C. Murali, & Dixit, U. S. (2010). Application of soft computing techniques in machining performance prediction and optimization: a literature review. The International Journal of Advanced Manufacturing Technology, 46, 445-464.
The Author:
PhD José Solis Romero
E-mail: jsolis@ittla.edu.mx
MSc. Sandra S. Roblero Aguilar
Dr. Víctor A. Castellanos Escamilla
Dr. Oscar A. Gómez Vargas
MSc. Miguel A. Paredes Rueda
Affiliation:
Public Education Secretary of Mexico
Instituto Tecnológico de Tlalnepantla
del TecNM
Postgraduate Office/Department of
Mechanical Engineering