E-Archive
Science Update
in Vol. 13 - January Issue - Year 2012
Determination Of Shot Peening Coverage
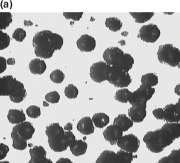
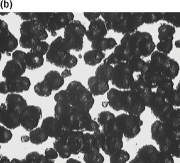
Figure 1: Images used for measuring coverage captured from peened specimens. The dark regions are the impacted area which accounts for the coverage: (a) 22.5% and (b) 98% coverage.
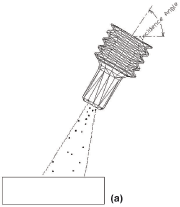
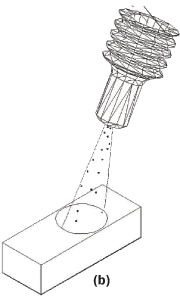
Figure 2: Schematic representation of the shot stream divergence: (a) the stream diverges at an angle determined by the type and incidence angle of the nozzle, (b) the spreading of the shot upon a surface
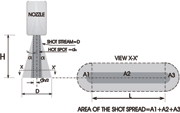
Figure 3: The basic geometry of the shot stream which diverges at an angle
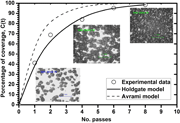
Figure 4: Coverage development for shot type S230 and 30
Abstract: The effectiveness of the shot peening process is dependent upon the energy transfer that occurs during the impact of shots with the target surface and the uniformity of the induced compressive residual stresses. In practice, the process is efficiency evaluated by means of coverage, intensity and saturation. As these latter parameters are commonly monitored during shot peening, in the present work the development of coverage has been studied for the 2024-T351 aluminium alloy.
Introduction
Coverage is defined as a measure of the area fraction of a component surface that has been impacted in a given peening time, usually expressed as a percentage. Coverage also represents a measure of the uniformity of the residual stresses in the subsurface layer. Accordingly, less than complete coverage is ineffective since the unpeened portion of the surface would contribute to an uneven distribution of the residual stresses and consequently, significant reductions in fatigue performance [1]. "100%" coverage is often used to represent approximately complete coverage, i.e., when the entire surface of a reference area has been indented. In theory, "100%" coverage cannot be achieved; since the approach to "100%" coverage is exponential (the probability of a very small area being covered by a new impression becomes smaller with exposure time). The well-known Avrami relationship [2, 3] supports such a statement:
“formula cannot be displayed online” (1)
where C(t) is the coverage at any particular time, r is the average radius of the indentations, R is the uniform rate of indentation creation and t is the time during which the dimples were being created.
A theoretical model has been developed by Holdgate [4] that can be used to predict the evolution of the coverage in a general peening system. The proposed model, based on the original relationship used by the Wheelabrator Corporation , is given as:
“formula cannot be displayed online” (2)
Where C(t + ?t) is the coverage after an increment of time, ?t; C(t) is the coverage at a known time t; ns is the number of peen sources; aj is the total area of indentation caused by the peens from the jth peen source at time ?t; S is the total area to be peened and ?Nj is the number of peens from the jth peen source expected to impact the reference area in an interval of time ?t.
From the above, complete coverage is therefore assumed to occur when the observed coverage reaches 98% as established in the related standards [5]. It is common practice that higher than complete coverage, multiples of "100%" are attained. Hence, for instance, 400% coverage is achieved by peening each specimen 4 times longer than that necessary for 100% coverage. Coverage can be assessed qualitatively by visual inspection of the peened surface employing a magnifying glass or by optical microscopy as occur in image analysis or following the dye scan tracer method. In this work, the development of coverage was determined experimentally with the use of image analysis technique. Two theoretical models, the Avrami and the Holdgate one are compared to predict the development of coverage.
Experimental
The percentage of obliteration of the original surface was determined employing the image analysis technique. Three images were captured for each specimen after each peening pass. An image from the 1st pass was used to determine the indentation of different shot sizes due to the minimum overlapping observed at this stage. Coverage determinations were conducted on 2024-T351 aluminium alloy specimens with dimensions 25 by 19 by (5-7) mm. The length of 25 mm together with a nozzle of velocity of 125 mm/sec across the sample rendered a time 0.2 seconds per pass, which facilitated the experimental work. The width of 19 mm was similar to the width of the Almen strips in order for facilitate the clamping on the holding fixture. A thickness greater than 5 mm was utilised to minimise the typical double deformation after peening as well as to avoid the end effects. The surface of each specimen was ground and polished to obtain a better contrast between peened and unpeened areas, as illustrated in Fig. 1.
The SigmaScan© software was used for the coverage determinations. A threshold value of image contrast for the unpeened area was predetermined before the analysis. The selected regions were the unpeened areas. Subtracting the unpeened area from the total area in each image yielded the peened area. The ratio of peened area to the total area represented the calculated coverage percentage.
The shot spread or shot stream divergence of each shot type/size and at different incidence angles was also measured. To enable sufficient room for the shot media to freely impact the specimen during the nozzle movement, a large aluminium sheet was utilised. The peening parameters: pressure (50 psi), nozzle stand-off distance (6 in) and flow rate (10 lb/min) were kept constant. The shot stream divergence is shown in Fig. 2. The detailed geometry of shot stream divergence is depicted in Fig. 3. It is observed that the width of the spread increases with the distance from the nozzle but reduces with the incidence angle according to the equation:
“formula cannot be displayed online” (3)
where, dn is the nozzle diameter (¼ in = 6.35 mm), H is the stand-off distance, ? is the divergence angle and ? is the incidence angle.
The shot spread area common to any peening condition is calculated as follows: A = (A1+A3)+A2 Where D = width of the shot spread and L = length of the shot spread after 1 second. Therefore,
“formula cannot be displayed online” (4)
For a particular case, coverage development is determined by using a shot type S230, incidence angle of 90°. A shot spread of D = 21 mm was measured when using a nozzle velocity of 125 mm/s. The total shot spread area is then given as: L = (125 mm/s)(1 sec) = 125 mm and using (4) it gives A = 2.971 x 10⁻³ m2 .
Results and conclusions
(a) The Avrami model.
Eq. (1) can be modified to accommodate the parameters that are easily determined for a particular peening system. Thus, R = M/m , where M is the mass of shot thrown per unit area per unit time.
M = m/A = mass flow rate of shots/Area of shot spread
Parameter m is the mass of a shot. Therefore, m = 4/3 ?r3 ?.
Where ? is the density of the shot and r is the average radius of the shots. The Avrami model can be re-written as:
“formula cannot be displayed online” (5)
If the mass flow rate, m = 10 1b/min = 0.07576 Kg/s, and the average shot radius, r = 0.3715x10⁻³ m.
The experimental indentation radius was: r = 0.299x10⁻³ m. The shot density was taken as ? = 7860 Kg/m3.
The experimentally measured shot spread area A = 2.971x10⁻³ m2, was used for calculations. Thus, substituting the above values into the Eq. (5), it gives:
“formula cannot be displayed online”
It reduces to C(t) = {1-exp(-4.2427t)}.
(b) The Holdgate model.
In the Holdgate general model, the jth represents the number of peen sources. However, for a single peen source only, the model is given by:
“formula cannot be displayed online” (6)
under the assumptions: a) time taken for 1 pass = ?t and b) at t=0, C(t)=C(0)=0
The ratio (a/S)1pass = coverage ratio after 1st pass = 0.543 (experimentally determined). The theoretical coverage assuming no peen overlapping was calculated as:
Time taken to peening the sample = Specimen length (mm)/ Nozzle speed (mm/sec) = 25/125 = 0.2 s
Peen flow rate, “formula cannot be displayed online” = 44880 peens/sec
Peen flow rate at 0.2 s, (Np)0.2 44800x0.2 = 8976 peens/0.2 s
Peens impacting the specimen ? (Np)0.2 x Specimen width/Width of shot spread = 8976 (19/21) = 8121 peens
The indentation created by single peen = ? r2 = ? (0.299)2 = 0.28086 mm2
The total area of indentation created by the peens impacting the specimen is given by: a = 8125x0.28086 = 2280 mm2 and the total area to be peened, S = 25x19 mm = 475 mm2.
Hence, (a/S)1pass = 2280/475 = 4.8
The possible reasons why the experimental and theoretical a/S ratio differ, may be due to overlapping, irregularities in the shot size and variations of the peening process itself like pressure, flow rate, and fluctuations in the oscillating movement of the nozzle. The experimental ratio of (a/S)1pass was used for the calculation of subsequent coverage percentages, as follows:
“formula cannot be displayed online”
A comparison among the experimental, Avrami and Holdgate percentage of coverage is shown in Fig. 4.
The experimental and theoretical results after a comprehensive work showed that the Holdgate model agrees well with the experimental results. The Avrami equation does not give a good coverage prediction due to the difficulty in determining the accurate input parameters that are used in this equation. Coverage development is a function of shot size, impingement angle and target material properties. Coverage development is faster using fine shot at and incidence angle of 90° and in soft target component.
References
1. Person, Neal L., (1981), "Effect of the shot peening variables on fatigue of aluminum forgings". Metal Progress. No. July: pp. 33-35.
2. Kirk, D. and MY, Abyaneh, (1993), "Theoretical basis of shot peening coverage control". In: The fifth International Conference on Shot Peening (ICSP-5). Oxford, U.K. Ed. D. Kirk. Coventry University: pp. 9-14.
3. Abyaneh, M.Y., (1996), "Fundamental aspects of shot peening coverage control part one: formulation of single and multiple impacting". In: Sixth International Conference on Shot Peening. Proceedings of the International Conference on Shot Peening (ICSP-6). California, USA. Ed. Jack Campaigne. pp. 438-447.
4. Holdgate, N.M.D., (1993), Peen mechanics in the shot peening process. PhD thesis, Mechanical Engineering., Cambridge, U.K.: Cambridge.
5. British Aerospace (operations), limited, 1997, "Shot peening for improved fatigue and stress corrosion resistance. British Aerospace (Airbus), PROCESS SPECIFICATION (ABP 1-2031)": England, UK. pp. 1-23.
Author:
Dr. José Solis Romero
E-mail: josesolis@infinitum.com.mx
MSc Saravanan Karuppanan
Affiliation:
SEP-DGEST-IT de Tlalnepantla
Walvoil Fluid Power India Pvt Limited


