E-Archive
Science Update
in Vol. 13 - May Issue - Year 2012
Crystal Plasticity Simulation on Fatigue Crack Propagation in Steel and Effect of Residual Stress by Cavitation Peening
![Fig. 1: Stress distribution introduced by CP [8]](https://mfn.li/storage/e-archives/article-pictures/1123/3033.gif)
Fig. 1: Stress distribution introduced by CP [8]
![Fig. 2 Comparison of crack propagation behavior between CP and NP specimens [8]](https://mfn.li/storage/e-archives/article-pictures/1123/3034.gif)
Fig. 2 Comparison of crack propagation behavior between CP and NP specimens [8]

Fig. 3: Computational model and distribution of the initial hydrostatic stress (33.3 MPa 33.3 MPa)

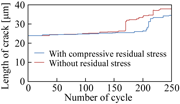
Fig. 4: Crack propagation caused by cyclic loading

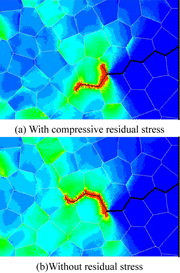
Fig. 5: Distributions of equivalent stress (0 MPa 300 MPa)

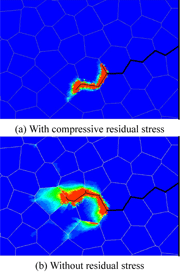
Fig. 6: Distributions of equivalent plastic strain (0.00 0.01)

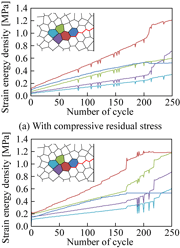
Fig. 7: Evolution of the strain energy density around the initial crack tip
Introduction
The peening such as cavitation peening (CP), shot peening and laser peening are well known as the technique for enhancing the fatigue life of mechanical components. In real application, in order to promote the use of peening for fail-safe design, it is required to suppress the critical damage during long-term operation of machinery. Thus, it is essential to know the characteristics of fatigue crack propagation of the material and select the effective peening method to suppress the fatigue crack propagation. In the case of CP, cavitation impact generated by collapsing bubbles causes severe damage in hydraulic machinery. The processing capacity by cavitating jet is sensitive to the nozzle outlet geometry [1,2] and CP can be applied to the gear and components of plants [3,4]. Moreover, Takakuwa et al. succeeded in the suppression of the hydrogen embrittlement by cavitating jet [5,6]. It is reported that compressive residual stress caused by CP affects to the hydrogen diffusion behavior [7].
In this work, in order to investigate the effect of residual stress caused by CP, they perform the crystal plasticity calculation considering the crack propagation along the grain boundaries. The residual stress is introduced into the specimen at the initial state to simulate the peened surface. Based on the results obtained from a crystal plasticity finite element (FE) analysis, they discuss the effect of the residual stress on the crack propagation behavior.
Effect of Cavitation Peening
Figure 1 shows the compressive residual stress introduced by CP as a function of depth from the peened surface [8]. The specimen consists of austenitic stainless steel Japanese Industries Standards JIS SUS316L. As Fig. 1 indicates, it proportionally decreases along with depth from the surface. Figure 2 shows the length of the fatigue crack propagation from precrack ?2a as a function of the number of cycle N [8]. As shown in Fig. 2, the average of crack propagation rate of CP specimen decreases by 70% compared with not-peened (NP) specimen. It is quite likely that the compressive residual stress introduced by CP is one of the major factors of the suppression effect.
Crystal Plasticity Model
Information about the stress field can be obtained using the crystal plasticity model [9]. The crystal plasticity-type elasto-viscoplastic constitutive equation is written in the form
“formula cannot be displayed online” , (1)
Where ? is the Mandel-Kratochvil rate of the Cauchy stress tensor, Ce is the anisotropic elastic moduli, D is the deformation rate tensor, ? is the Schmid tensor on slip system ?, and ? is the slip rate. This slip rate, ?, is given by the rate dependent hardening law of Pan-Rice, as follows:
“formula cannot be displayed online” , (2)
where ? denotes the referential slip rate, ? is the resolved shear stress, ? is the flow stress, and m is the strain rate sensitivity. The evolution equation of flow stress is represented by
“formula cannot be displayed online” , (3)
where ? is the hardening modulus. The flow stress is given by the extended Bailey-Hirsch equation, as follows [9]:
“formula cannot be displayed online” , (4)
where ? is the referential flow stress, ? is the dislocation interaction matrix, a is the numerical factor whose orders is 0.1, µ is the elastic shear modulus, ? is the magnitude of Burgers vector and ? is the dislocation density. The rate of dislocation density ? is decided by the balance between the accumulation and annihilation of dislocation, i.e.,
“formula cannot be displayed online”. (5)
where ? and ? are the rate of accumulation and annihilation of dislocation, respectively. In this study, they define the evolution equation of accumulated dislocation density such as [10]
“formula cannot be displayed online”. (6)
where r denotes the mean length of remained dislocation lines and ? is the density of forest dislocations. Taking account of annihilation of existing dislocations and generated dislocations, the recovery rate of dislocation is given by
“formula cannot be displayed online” , (7)
where k is the annihilation ratio and the value corresponds to the inverse of saturated density of dislocation. Differentiating Eq. (4) with respect to time, the hardening modulus can be obtained as
“formula cannot be displayed online”. (8)
While, when a crack is generated, elastic strain energy is translated into surface energy. In other words, when the density of local elastic strain energy Ee (the elastic strain energy per unit volume) exceeds the density of surface energy EC (the surface energy per unit volume), a crack propagates. The density of elastic strain energy Ee is given by
“formula cannot be displayed online” , (9)
where De is the elastic deformation rate tensor. Moreover, EC is represented by
“formula cannot be displayed online” , (10)
where e? is the density of the surface energy per unit area and A is the area of the generated crack.
Computational Model
In a crystal plasticity FE simulation, a polycrystal of stainless steel under a plane strain condition is assumed and the number of grains is 900 [see Fig. 3]. The initial width and height of the specimen are 480 µm and 120 µm, respectively. Delaunay triangulation is adopted for the meshing of the FEM to express inhomogeneity in the shape of the grains. The number of elements used for the FEM is 157981. The initial crack depicted by the red line in Fig. 3 occurs along the initial grain boundary. The length of this initial crack in the horizontal direction is 24 µm. The other material constants and numerical parameters are given by
“formula cannot be displayed online” . (11)
They assume that the area of the generated crack is constant because the sizes of the elements for the FEM are almost uniform to simplify the calculation. A cyclic load of 100 MPa is applied at the upper end of the specimen and the stress ratio is zero. The initial stress corresponding to the residual stress induced by CP is applied as shown in Fig. 3. They conduct a pseudo-three- dimensional computation [11], which assumes a plane strain condition only in the FE simulation by restricting the three-dimensional deformation caused by the activation of twelve slip systems of the FCC crystal to two-dimensional components on an observation plane. The initial crystal orientation of each grain is decided randomly. Because of the generation of a crack, the connection between the FEM nodes along the grain boundaries is cut, and in this case, the density of the elastic strain energy expressed by Eq. (9) exceeds the density of the surface energy represented by Eq. (10). The strain energy density is calculated at each node of the FEM. The average value of all the elements contacting a node is used as the density of the elastic strain energy at the node.
Results and Discussions
Figure 4 shows the crack length with the number of cycle in the cases that the initial hydrostatic stress is applied and the residual stress is neglected. The rate of crack propagation is higher than the experimental data, because they use the small value of the density of surface energy EC to reduce the calculation time. They find that the crack hardly propagates when the compressive residual stress is introduced. However, the difference is slight, since the applied compressive residual stress is small in this calculation.
The distributions of the equivalent stress as well as the equivalent plastic strain around the initial crack tip are shown in Figs. 5 and 6 respectively. In these figures, the bold and thin black lines represent the initial and generated cracks respectively. The existence of the compressive residual stress affects to the crack shape and the each distribution. The tendency of distributions of the equivalent stress is similar, whereas the value is low in the case where the compressive residual stress is introduced. Meanwhile, the plastic deformation occurs only around the generated crack when the compressive residual stress is applied [see Fig. 6]. In the present calculation, they use the same hardening parameter such as the initial dislocation density for the both condition. It is considered that the effect of hardening induced by CP accelerates the tendency shown in Fig. 6.
Figure 7 shows the evolution of the strain energy density around the initial crack tip. These values are averaged in each grain shown in Fig. 7. The value of strain energy density is smaller when the compressive residual stress is introduced. These results indicate that the compressive residual stress suppresses the increase of strain energy density and the rate of crack propagation becomes small.
Conclusions
It is numerically predicted that the compressive residual stress introduced by CP suppresses the spread of plastic deformation region and the increase of strain energy density around the crack tip.
References
1. Soyama, H. and Takakuwa, O., 2011, “Enhancing the Aggressive Strength of a Cavitating Jet and its Practical Application,” Journal of Fluid Science and Technology, Vol. 6, No. 4, pp. 510-521.
2. Soyama, H., 2011, “Enhancing the Aggressive Intensity of a Cavitating Jet by Means of the Nozzle Outlet Geometry,” Journal of Fluid Engineering, Vol. 133, pp. 101301-1-101301-11.
3. Soyama, H. and Sekine, Y., 2010, “Sustainable Surface Modification Using Cavitation Impact for Enhancing Fatigue Strength Demonstrated by a Power Circulating-Type Gear Tester,” International Journal of Sustainable Engineering, Vol. 3, No. 1, pp. 25-32.
4. Soyama, H., Kikuchi, T., Nishikawa, M. and Takakuwa, O., 2011, “Introduction of Compressive Residual Stress into Stainless Steel by Employing a Cavitating Jet in Air,” Surface and Coatings Technology, Vol. 205, No. 4, pp. 3167-3174.
5. Takakuwa, O., Ohmi, T., Nishikawa, M., Yokobori, Jr., A.T. and Soyama, H., 2011, “Suppression of Fatigue Crack Propagation with Hydrogen Embrittlement in Austenitic Stainless Steel by Cavitation Peening,” Strength, Fracture and Complexity, Vol. 7, No. 1, pp. 79-85.
6. Takakuwa, O. and Soyama, H., 2012, “Suppression of Hydrogen-Assisted Fatigue Crack Growth in Austenitic Stainless Steel by Cavitation Peening,” International Journal of Hydrogen Energy, Vol. 37, No. 6, pp. 5268-5276.
7. Takakuwa, O., Nishikawa, M. and Soyama, H., 2012, “Numerical Simulation of the Effects of Residual Stress on the Concentration of Hydrogen around a Crack Tip,” Surface and Coatings Technology, Vol. 206, Nos. 11-12, pp. 2892-2898.
8. Takakuwa, O., Nishikawa, M. and Soyama, H., 2010, “Suppression of Fatigue Crack Propagation in Steel by Cavitation Peening,” Metal Finishing News, Vol. 11, No. 4, pp. 58-60.
9. Aoyagi, Y. and Shizawa, K., 2007, “Multiscale Crystal Plasticity Modeling Based on Geometrically Necessary Crystal Defects and Simulation on Fine-Graining for Polycrystal”, International Journal of Plasticity, Vol. 23, No. 6, pp. 1022-1040.
10. Aoyagi, Y., Shimokawa, T., Shizawa, K. and Kaji, Y., 2012, “Simulation on Nanostructured Metals Based on Multiscale Crystal Plasticity Considering Effect of Grain Boundary”, Materials Science Forum, Vols. 706-709, pp. 1751-1756.
11. Aoyagi, Y., Horibe, N. and Shizawa, K., ‘’Multiscale Crystal Plasticity Simulation with Pseudo-Three-Dimensional Model on Ultrafine-Graining Based on Evolution of Dislocation Structures’’, Materials Science Forum, Vols. 584-586, (2008-08), pp. 1057-1062.
Yoshiteru Aoyagi (Ph.D. in Eng.)
Associate Professor
E-mail: aoyagi@mm.mech.tohoku.ac.jp
Osamu Takakuwa
Graduate student
E-mail: o_takakuwa@mm.mech.tohoku.ac.jp
Hitoshi Soyama (Dr. Eng.)
Professor
E-mail: soyama@mm.mech.tohoku.ac.jp
Department of Nanomechanics
Tohoku University
6-6-01 Aoba, Aramaki, Aoba-ku, Sendai
980-8579, Japan


