E-Archive
Cover Page
in Vol. 15 - September Issue - Year 2014
Almen Saturation Curve From A Statistical Perspective

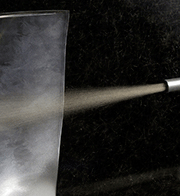
Peening of the leading edge of a turbine blade


As widely known in the shot peening field, Intensity is an indirect measurement of the kinetic energy of the shot stream. It is a common opinion that the most accurate method of estimating peening intensity is to produce and analyze a saturation curve. Modern technology also enables direct measurements of the shot stream velocity. As a matter of fact, direct measurements of the average speed of the shot stream can be made by special instruments, but when it is necessary to know the effect of the stream on the real shape of the part being peened, the most accurate way still remains the saturation curve.
The most recent specifications regarding this issue, included SAE J443 and J2597, seem to be in agreement requiring a minimum of four Almen strips for a saturation curve. Once the Almen strips are peened, the arc height values can be entered in a graph, a "smooth curve" can be manually drawn or preferably, a fitting software could graph the curve, and then the Almen intensity is determined by the 10% rule.
Two considerations have to be made at this point. Do Almen strips and the respective arc heights have the same statistical relevance? Can Saturation curve give additional information other than intensity? To answer these questions it is necessary to deal with dispersion and standard deviation.
Every natural phenomenon is characterized by a certain amount of "natural" or random variation. Each time measurement is repeated or an experiment is replicated, different values are obtained. Sometimes the single values within a group of measurements are very close to each other, other times they are quite far from each other. The two following batches of numbers could refer, for example, to experimental measurements of the same process at different times with two different settings that will be called Exp1 and Exp2.
Each process has 10 single measurements made at different times that will be called replicates. Observing the average values of Exp1 and Exp2, it can be noticed that they are exactly coinciding, but it is easy to understand that those two experiments are very far from being comparable. Exp1 ranges from 9.5 to 10.5 and Exp2 ranges from 7 to 14, even if the mean value is the same. When different batches of numbers are compared, either the average or the dispersion of the values around the average must be taken into account. The global mean value represents the average magnitude of the phenomenon, while the dispersion represents its reliability or the robustness. The dispersion can be evaluated with a parameter known as "standard deviation". Standard deviation can be estimated as the mean square root of the difference of each single replicate from the mean value divided by the degrees of freedom as represented by the following formula.
S =
Where S is the estimate of the standard deviation, n is the number of replicates, Xi is the ith replicate and Xm is the average of the n replicates.
Calculating the standard deviation of the two experiments, according to the formula above, Exp1 will have a standard deviation of 0.3 while Exp2 will have a standard deviation of 2.2, seven times larger than Exp1.
From a statistical point of view, the lower the standard deviation of an experiment, the higher the probability each single event or replicate will be close to the experiment mean value. From a practical point of view, the lower the standard deviation of the group of replicates, the higher the robustness of the experiment. Thus, it is possible to conclude that each single replicate of Exp1 has a higher "reliability" in representing Exp1 in its entirety than does that of Exp2.
When different batches of numbers with different mean values are compared, in order to evaluate the robustness or reliability of each single batch, relative standard deviation in place of standard deviation should be used. Relative standard deviation is defined as the standard deviation divided by the mean value of the batch. Relative standard deviation is expressed in percentage form. In that way it, for example, a process with a mean value of 20, a standard deviation of 0.8 and a consequent relative standard deviation of 4%, should be considered more robust or reliable than a process with a mean value of 10 with a lower standard deviation of 0.6 but a higher relative standard deviation of 6%.
Once the meaning of standard deviation, relative standard deviation and how to use them is quite clear, the Almen saturation curve can be analyzed from a statistical point of view.
If several Almen strips are peened at each exposure time, either mean value or dispersion for each of the exposure times can be calculated. In that way, also relative standard deviation for each exposure time can be calculated.
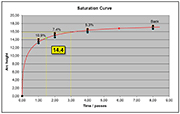
In order to answer the first question regarding the statistical relevance of arc height readings, looking at either DoE or LPR, it is quite clear that the strips after intensity point show lower relative standard deviation obtaining greater statistical meaning than the ones before intensity point. For that reason, it is convenient to have the greater part of the strips after intensity point. In addition, that a good shot peening process should show a saturation curve with a remarkable trend to flatten must also be taken into consideration. If the saturation curve does not have enough readings after intensity point, it is not possible to understand whether the curve flattens or not. Current specifications require that the range T-2T must be within the range covered by the strips. According to the above, it is possible to obtain more reliable saturation curves if the range is T-3T or even better, T-4T, then it falls within the range covered by the strips as depicted by the little red dot on the saturation curve.
In order to answer the second question regarding the possibility of using the saturation curve not only for determining the intensity value but even more importantly, to assess the shot peening production process, it should be considered that the experimental readings of the Almen stripfs arc height should fall quite close to the fitting curve. Current specifications do not mention this fact, but creating database recording day-by-day curves and calculating deviations from the fitted values could help to evaluate the shot peening production process. When some reading falls outside the standard parameters, this can be an alarm bell. In the end, from a fatigue point of view, keeping the peening process under strict control is of the utmost importance.
Design of Experiment "DoE"
An experimental design was run with the purpose of investigating the variability of the shot peening process under various conditions. Several machine configurations were examined to simulate different plants and different setups. Design parameters were shot dimension, shot flow rate, hose diameter and intensity. An 8 mm nozzle and a standoff distance of 150 mm were used. Sixteen saturation curves were run, each of them with four exposure times and each exposure time replicated 3 times. Twelve strips were run for each curve as depicted in the above figure.
A total of 192 Almen strips were used for the experiment. For each exposure time, the mean value, the standard deviation, and the relative standard deviation as a percentage of the mean value were calculated. The mean values and the relative standard deviations of the corresponding time units were grouped onto a kind of a "central saturation curve" (figure above) leading to the conclusion that the higher the exposure time, the lower the relative standard deviation, as shown in the following table.
|
Pooled Time Units |
Pooled Mean |
Pooled St.Dev.% |
|
1 |
13.6 |
1.29% |
|
2 |
15.1 |
1.19% |
|
4 |
16.2 |
1.03% |
|
8 |
17.1 |
0.93% |
Long Production Run "LPR"
As a confirmation of the results shown by the experimental plan above, two wide production runs were analyzed. Twenty ongoing verification curves considered as 20 replicates, were examined for each single production. Each curve was constructed by 4 Almen strips, as usual, for a total of 80 Almen strips for each production. One hundred and sixty Almen strips in total were analyzed.
Mean values and results are reported in the following two tables.
In both production runs, it is possible to see a confirmation of the trend. In particular, in these two production runs, it is possible to notice a global lower relative standard deviation in comparison to what was obtained in the Experimental Design. This can be explained by the fact that in the experimental plan, very different machine setups were pooled and analyzed, while these two production runs are two single setups very similar to each other.
For Information:
Peen Service s.r.l.
Via Augusto Pollastri 7
40138 Bologna, Italy
Tel. +39.051.533550
Fax +39.051.531307
E-mail: m.bandini@peenservice.it
www.peenservice.it


