E-Archive
Science Update
in Vol. 17 - July Issue - Year 2016
Mechanical Surface Treatment of Duralumin by Laser Abrasion and Laser Cavitation

Fig. 1: Schematic diagram of submerged laser peening system
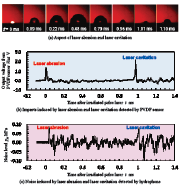
Fig. 2: Laser abrasion and laser cavitation
![Fig. 3: Relation between developing time of laser cavitation and diameter of laser cavitation [9]](https://mfn.li/storage/e-archives/article-pictures/1645/4745.gif)
Fig. 3: Relation between developing time of laser cavitation and diameter of laser cavitation [9]
![Fig. 4: Relation between developing time and noise level of laser cavitation [9]](https://mfn.li/storage/e-archives/article-pictures/1645/4746.gif)
Fig. 4: Relation between developing time and noise level of laser cavitation [9]
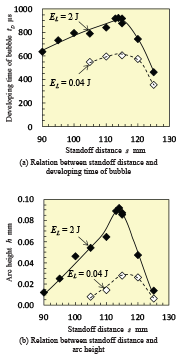
Fig. 5: Optimum standoff distance evaluated by developing time of bubble and arch height
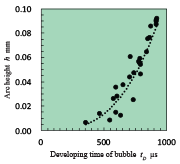
Fig. 6: Relation between developing time of bubble and arc height
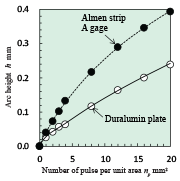
Fig. 7: Arc height changing with number of laser pulse per unit area
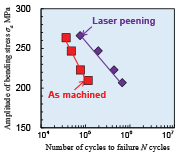
Fig. 8: Improvement of fatigue life of duralumin plate with a hole by submerged laser peening
Introduction
Laser peening can be divided into two types. One of them is that a target, which is covered with tapes or paint with water film, is exposed to a pulse laser [1, 2]. In the other type, a pulse laser impacts a target that is placed in a water-filled chamber [3]. In the present report, the latter laser peening method is named as submerged laser peening.
In the both above-mentioned laser peening methods, it is believed that the shock wave of laser abrasion by the pulse laser produces the peening effect. As well known, in the case of the submerged laser peening, a bubble is produced after the laser abrasion and it behaves like a cavitation bubble, namely the bubble case shock wave. In the present paper, the bubble after the laser abrasion is called a "laser cavitation". It was reported that the shock wave induced by the collapse of the laser cavitation was much smaller than that of the laser abrasion [4]. However, it was also reported that the noise level related to the shock wave of laser cavitation was stronger than that of laser abrasion [5, 6].
In the present paper, in order to make clear the peening mechanism on the submerged laser peening, the impacts of the laser abrasion and the laser cavitation were examined.
Laser Abrasion and Laser Cavitation at Submerged Laser Peening
Figure 1 illustrates a submerged laser peening system. The maximum energy of the used pulse laser is 0.22 J and pulse duration is 5 ns. The focal length of the final convex lens was 100 mm. The pulse laser impacts the target placed in the water-filled chamber. In order to detect the impact force, a handmade PVDF sensor [7, 8] was developed.
The PVDF film was put on duralumin base of 30 mm in thickness with Kapton tape which was an insulating material, and the duralumin plate of 10 mm in thickness covered the PVDF film. The pulse laser exposed the duralumin plate.
In order to show the aspect of the laser abrasion and the laser cavitation, Fig. 2 (a) shows aspects observed by a high speed video, and Fig. 2 (b) and (c) illustrate the output signals from the PVDF sensor and the hydrophone. A pulse laser was exposed to the duralumin plate at t = 0. After the laser abrasion, the laser cavitation was developed and collapsed at t ? 1 ms, then rebounded. The rebound causes the shock wave as well as the laser abrasion. This is why the laser cavitation produces impact. The impact force due to the laser abrasion was detected by the PVDF sensor at just after the exposure t = 0. The amplitude of the signal induced by the laser abrasion was 1.31 V. At the collapse of the laser cavitation, the other impact was detected by the PVDF sensor. The amplitude of the impact at t ? 1 ms is 2.08 V. It is obvious that the impact produced by the laser cavitation is 1.59-fold larger than that of the laser abrasion.
As shown in Fig. 2 (c), the peaks of noise were detected by the hydrophone. Note that the noise level of the laser cavitation was nearly the same level of the laser abrasion. In the case of the present submerged laser peening, the impact force of the laser cavitation is much stronger than that of the laser abrasion. Thus, when the impact force of laser cavitation is enhanced by considering the cavitation phenomena, the peening efficiency of submerged laser peening can be improved.
Developing Time of Laser Cavitation
In order to investigate the main parameter of the submerged laser peening, Fig. 3 illustrates the relation between the developing time of the laser cavitation and the diameter of the laser cavitation [9]. In Fig. 3, the spherical bubbles induced by the pulse laser without a target and the hemispherical bubbles by the pulse laser with a target were plotted. It is obvious that the diameter of the laser cavitation is proportional to the developing time of the laser cavitation including both of the spherical bubbles and the hemispherical bubbles. Namely, when the developing time of the laser cavitation is measured, the diameter of the laser cavitation can be estimated. It can be concluded that the developing time, i.e., the time from the laser abrasion to the bubble collapse, is one of the main parameters of the laser cavitation.
In order to estimate the impact at the collapse from the size of the laser cavitation, Fig. 4 illustrates the relation between the developing time of the laser cavitation and noise level at the collapse of the laser cavitation [9]. The noise level was detected by a hydrophone, which was placed in the water-filled chamber. When the developed time was increased, that meant the bubble size was increased, so the noise level at the collapse also increased. It seems that the noise level is increased when the gas content of the water was decreased. Namely, the impact force at the collapse of the laser cavitation roughly increases with an increase of the size of the laser cavitation; the impact force is affected by the water quality such as gas content ratio of the water and water temperature.
Relation between Peening Intensity and Developing Time of Laser Cavitation
In order to reveal the relation between peening intensity and developing time of the laser cavitation, Fig. 5 (a) shows the developing time of the laser cavitation changing with standoff distance s, which is distance from the final convex lens to the target, and Fig. 5 (b) illustrates the arc height of duralumin plate at laser energy EL = 0.04 J and 0.2 J. The target material was the duralumin plate made of Japanese Industrial Standards JIS A2017-T3. The thickness of target was 5 mm. In the case of the arc height measurement, the duralumin plate was treated at 4 pulse/mm2 and measured by an Almen gage. The developing time was measured by using the output signal from the hydrophone. As shown in Fig. 5 (a), the developing time of the laser cavitation has a peak at s ? 115 mm for both EL = 0.04 J and 0.2 J. The laser cavitation cannot develop enough at too short or too long a standoff distance. At the optimum standoff distance where the developing time has a maximum, the diameter of the laser cavitation has a maximum, as the diameter of bubble is proportional to the developing time as shown in Fig. 3. On the other hand, the arc height shows the peening intensity also has a peak at s ? 115 mm for both EL = 0.04 J and 0.2 J. This means that the arc height has a peak at the standoff distance where the developing time has a maximum. Namely, the peening intensity has a peak when the size of the laser cavitation has a maximum.
In the case of the submerged laser peening, the size of the laser cavitation is affected by the water quality of the water in the water-filled chamber as mentioned above. In the present submerged laser peening system, the fresh water was fed into the chamber in order to eliminate the contamination due to the laser abrasion. The contamination and the dust decrease the pulse laser energy that reaches the target. The small tiny bubble in water also decreases the pulse laser energy. Namely, the water quality affects the pulse laser energy, which produces the laser abrasion and the laser cavitation. Of course, the size of the laser cavitation is affected by the pulse laser energy itself. In order to investigate the relationship between the size of the laser cavitation and the peening intensity, Fig. 6 illustrates the relationship between the developing time of the laser cavitation and the arc height changing with the pulse laser energy, the standoff distance and the water quality. The arc height h is roughly increased with the developing time tD of the laser cavitation. When the approximated line is assumed for the data of Fig. 6, the following relation is obtained.
h ? tD3.02 (1)
Namely, the peening intensity is proportional to the volume of the laser cavitation.
Peening Effect of Present Submerged Laser Peening System
In order to reveal the peening effect of the present submerged laser peening system, Fig. 7 shows the arc height of Almen strip gage A and the duralumin plate. The thickness of the used duralumin plate was 5 mm. The used standoff distance for Almen strip and the duralumin were 118 mm and 114 mm, respectively. These standoff distances were obtained by the arc height measurement changing with the standoff distance. As shown in Fig. 7, the arc height h was increased with the number of pulse per unit area np.
In order to show the other peening effect, Fig. 8 illustrates the results of a plate bending fatigue test using a duralumin plate with a hole. The detail of the fatigue test and the shape of the fatigue specimen are in the reference [10]. In the case of the laser peening, the specimen was treated by the present submerged laser peening system at optimum standoff distance, i.e., 114 mm, with 4 pulse/mm2. As shown in Fig. 8, the fatigue life of the laser-peened specimen was improved compared with that of the as-machined specimen. The ratio of improvement by the submerged laser peening is longer at lower amplitude of bending stress ?a. For example, at ?a = 223 MPa, N of the as-machined specimen was 76,600 and N of the laser-peened specimen was 437,400. On the other hand, at ?a = 247 MPa, N of the as-machined specimen was 47,800 and N of the laser-peened specimen was 193,200.
Conclusions
In order to investigate the mechanism of the submerged laser peening, the impact force was measured by using the special handmade sensor observing the laser abrasion and the laser cavitation by high-speed video. It was concluded that the impact force induced by the laser cavitation collapse was about 1.6-fold larger than that of the laser abrasion. The developing time of the laser cavitation had a maximum at the optimum peening condition, so can be used for monitoring of the peening intensity of the submerged laser peening.
Acknowledgement
This work was partly supported by Machine Tool Engineering Foundation. The author thanks Mr. M. Mikami, technician, Tohoku University for his help with the experiment.
References
[1] O. Hatamleh, J. Lyons, and R. Forman, "Laser and shot peening effects on fatigue crack growth in friction stir welded 7075-T7351 aluminum alloy joints," International Journal of Fatigue, vol. 29, no. 3, pp. 421-434, 2007.
[2] A. Gill, A. Telang, S. R. Mannava et al., "Comparison of mechanisms of advanced mechanical surface treatments in nickel-based superalloy," Materials Science and Engineering: A, vol. 576, pp. 346-355, 2013.
[3] Y. Sano, M. Obata, T. Kubo et al., "Retardation of crack initiation and growth in austenitic stainless steels by laser peening without protective coating," Materials Science and Engineering A, vol. 417, no. 1-2, pp. 334-340, 2006.
[4] A. Sasoh, K. Watanabe, Y. Sano et al., "Behavior of bubbles induced by the interaction of a laser pulse with a metal plate in water," Applied Physics a-Materials Science & Processing, vol. 80, pp. 1497-1500, 2005.
[5] H. Soyama, "Surface mechanics design by cavitation peening," Journal of Engineering, vol. joe.2015.0055, pp. 1-5, 2015.
[6] H. Soyama, H. Sasaki, S. Endo et al., "Mechanical surface treatment of duralumin plate by bubble induced by pulse laser," Journal of Physics: Conference Series, vol. 656, no. 012108, pp. 1-4, 2015.
[7] H. Soyama, A. Lichtarowicz, T. Momma et al., "A new calibration method for dynamically loaded transducers and its application to cavitation impact measurement," Journal of Fluids Engineering, Trans. ASME, vol. 120, no. 4, pp. 712-718, 1998.
[8] H. Soyama, Y. Sekine, and K. Saito, "Evaluation of the enhanced cavitation impact energy using a PVDF transducer with an acrylic resin backing," Measurement, vol. 44, no. 7, pp. 1279-1283, 2011.
[9] H. Soyama, "Similarity between cavitation bubble produced by pistol shrimp and bubble induced by pulse laser," Annual Meeting of Tohoku Branch, JSME, pp. 63-64, 2016.
[10] H. Soyama, "The use of cavitation peening to increase the fatigue strength of duralumin plates containing fastener holes," Materials Sciences and Applications, vol. 5, no. 6, pp. 430-440, 2014.
Department of Finemechanics
Tohoku University
6-6-01 Aoba, Aramaki, Aoba-ku, Sendai
980-8579, Japan
E-mail: soyama@mm.mech.tohoku.ac.jp


