E-Archive
Science Update
in Vol. 7 - January Issue - Year 2006
Crack Arrest Of Controlled Shot Peening On Fatigue Damage Of High Strength Aluminium Alloys (Part II)

Author: Jose Solis Romero (Ph.D.)

Author: MSc. Francisco Sandoval Palafox

Author: Ulises Figueroa L

Figure 1: Test piece dimensions

Table 1: Mechanical properties and chemical composition
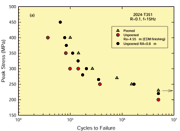
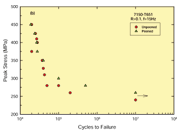
Figure 2: Fatigue behaviour of the peened and unpeened AA 2024-T351 shown in graph (a) and AA 7150-T651 illustrated in graph (b) respectively
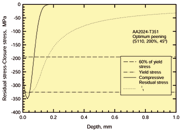
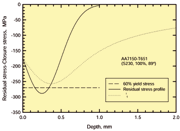
Figure 3: Experimental residual stress profiles and a calculated closure stress for each of the AAs
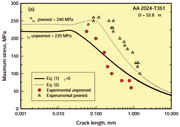
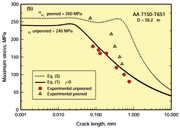
Figure 4: Experimental Kitagawa-Takahashi diagrams describing the crack arrest conditions for the unpeened and peened AAs at stress ratio of 0.1. The dotted line in both diagrams incorporates the effect of the residual stress.
Introduction
In previous papers, the mechanics of crack arrest to peened materials was studied. The crack arrest curve identifies three controlling parameters: a) the effect of the strength of the grain boundary which is incorporated within the FL, b) the effect of the grain orientation, mi and the effect of the closure stress. These parameters reflect the influence of the microstructure. The first, by relating the strength of the boundary with some constant mechanical properties of the material; the second, by connecting the relevant orientation of successive slip planes with a parameter that controls the magnitude of plastic deformation (critical resolved shear stress) and in the third the residual stress profile will provide a corresponding crack closure stress that will reduce the driving force for crack propagation.
In this work, the theoretical limits given by the crack arrest curve of the peened and unpeened materials are validated with experimental results taken from the testing of 2024-T351 and 7150-T651 aluminium alloys.
Materials and Specimen
Preparation
The chemical composition and mechanical properties are depicted in table 1. The alloys were received in the form of 30 mm thick rolled plate, with preferred grain orientation. The average grain sizes for the longitudinal (L), transverse (T) and short transverse (S) were 220µm, 80 µm and 52.8 µm respectively for the 2024-T351 AA; whilst for the 7150-T651 AA discernable variations in grain size were found. An average grain size for the S direction of 58.4 µm was measured and considered to be representative of this material for calculation purposes.
A testing procedure leading to the Kitagawa-Takahashi diagram was performed in a four-point bending configuration. Test-pieces were cut parallel to the rolling direction using electro-discharge machining (EDM). Test-piece dimensions are shown in Figure 1. The gauge surface of the four-point bending specimens was polished using a succession of finer grade emery papers and diamond pastes to a ¼ micron finish.
Peening Conditions and Effects Characterisation
Controlled shot peening was performed using a direct-pressure air blast type peening machine, fully described in [1]. Optimum SP conditions were employed as indicated in [2], (for AA 2024-T351 a cast steel shot S110, an intensity of 0.157 mm A (4A), an incidence angle of 45º and 200% coverage rate; in the case of AA 7150-T651, S230, 0.579 (14.7 A), 89º and 100).
Peening of the samples was carried out with the nozzle oscillating over the target under automatic control. The nozzle was that of the Venturi type with nominal bore of 6.35 mm (1/4 in.). The standoff distance was set to 152.4 mm (6 in.). The gauge surface was shallow polished just to enable crack observation without altering the compressive layer underneath the indented surface. The incremental hole drilling technique [3] was utilised to characterise the residual stress depth distribution. A milling guide RS-200 with air turbine (Measurements Group, Inc.) was used to create a cylindrical blind hole. Surface strain relief was obtained by a three-element strain gauge rosette (CEA-06-062UL-120). Residual strain data was processed following the incremental strain method. This latter was done by using a special off-line Windows®-based computer program (ReStress®) from Measurements Group, Inc. Work hardening effect was evaluated using a Leitz Miniload microhardness tester at loads of 50-100 g; in depth increments of 0.030 to 0.050 mm up to a distance of 0.6 mm were carried out. The roughness was determined using a bidimensional profilometer.
The Kitagawa-Takahashi Diagram
The Kitagawa-Takahashi diagram for both AAs was determined for both peened and unpeened specimens. Cracks were initiated by cycling at maximum stress slightly exceeding the fatigue limit (by about 5%). The initiated cracks were observed after preset numbers of loading cycles, by a light microscope mounted on the testing equipment using a video camera mounted on the optical microscope and a dedicated video capturing card supported by a high-end computer. The determination of the threshold stress was following a repeated load-shedding procedure.
The procedure involves propagation and arrest of a certain length fatigue crack. The stress level below which the crack growth rate was less than 3x10⁻¹⁰ m/cycle was defined as the arrest point. The size of the detectable cracks was around 50 m. All cracks were measured using image analysis software (SigmaScan®) based on the tracking of the crack. All tests were performed under load control with a sinusoidal wave form at a frequency of 15 Hz. The stress ratio was set to R= 0.1 (min/max). The fatigue limits were determined on the basis of 107 cycles for both AAs.
Results and Conclusions
In Fig. 2, experimental fatigue life data are presented in the form of a Wöhler or S-N approach. The 7150-T651 AA exhibited an unusual steeped transition from the low cycle fatigue to long life regime in both peened and unpeened specimens. This behaviour can be attributed to the fact that the material contained large size microstructural defects. These defects act as stress concentrations, which diminish, for a wide range of applied stress levels, the importance of other fatigue limit controlling features like the grain size and the grain boundaries.
The endurance limit was in turn, marginally influenced by the CSP treatment in both AAs. The 2024-T351 AA recorded fatigue limits of 220 and 240 MPa for the unpeened and peened specimens respectively, whilst for the 7150-T651 AA, values of respectively 240 and 260 MPa were obtained. The measured residual stress depth profiles and the calculated closure stress i1 after shot peening are shown in Fig 3.
The error of the stress measurement is estimated to be less than ±20 MPa. Maximum compressive residual stresses of approximately -350 MPa were found near the surface (40 µm depth) in 2024-T351 AA and -288 MPa at deeper distance from the surface (250 µm). The variation in residual stress distribution depends upon the plastic deformation of the surface during shot peening, since the plastically deformed surface layer tends to expand, but is restrained by the adjacent undeformed substrate. The discrepancy exhibited by the two materials is due to the state of the equi-biaxial compressive residual stress introduced, which will change according to the yield strength in compression of each material. Additionally, the difference in workpiece states before peening, specifically workpiece hardness is considered as one of the most important factors [6]. The magnitude of the maximum compressive residual stresses rsmax, increases with increasing hardness. The discernable difference is, however, marginal because of the stretching effects occurring during shot peening. In this case, the peening work hardening of the 2024-T351 AA leads to an increase in the residual stresses, which even exceeds the yield strength of the unpeened condition. In contrast, the higher hardness of the 7150-T351 AA, means that the rsmax also increases as the peening work hardening does, but the Hertzian pressure dominates by virtue of the observed deepest microhardness variations. Strictly speaking, with increasing workpiece hardness, depth and diameter of shot indentations become smaller. The pressure due to the impact of the shot in conjunction with the maximum shear stress becomes higher. That is, with increasing hardness, less energy is consumed for plastic deformation of the surface peened layers, and more energy is available for plastic deformation in deeper layers [6]. Therefore, deeper deformation may occur in further layers and a higher maximum magnitude of the compressive residual stresses may be produced.
Plastic deformations caused by collision of the peens on the target surface, at strain rates sufficiently high (approximately 9x10⁵ s-1 for the S110 shot and 2.5x10⁵ s-1 for the S230 shot) active the fast moving of dislocations [7]. Hardness variations exhibited by the two AA’s indicate the presence of a microstructural strain hardening effect due to an induced multiplication of dislocations caused by the inhomogeneous plastic deformation on the surface material, during shot peening. As anticipated, higher microhardness variations were found in the softer workpiece in relation to the harder workpiece. In shot peening of 2024-T351 AA, the mechanism of plastic deformation seems to be analogous to that of stretching the surface layers, whilst for the 7150-T651 AA resembles that of Hertzian behaviour.
The Kitagawa-Takahashi diagram plot for the 2024-T351 AA is presented in Fig. 4. The experimental data represent the stress level at which the crack of the given size stopped propagating. In both unpeened alloys the experimental data correlates well with the predicted values as shown in Fig. 4. A discernable difference is observed on peened materials tough. Whilst for the 2024-T351 AA the experimental data exceeded the calculated values, the experimental data of the 7150-T651 AA showed a much steeper decay as the crack grew.
The evident effect of the peening conditions for each AA shown in Fig. 4 makes clear that the performance of the controlled shot peening in terms of fatigue depends on the competition between its beneficial and detrimental products. It is also clear that the surface deformation may be introducing a large population of surface flaws which may be acting as sites for crack initiation, although subsequent growth of most cracks are impeded by the compressive stress field but damage could be caused due to some remnant.
References
1. Solis-Romero, J., E.R. de.los.Rios, Y.H. Fam, and A. levers. (1999), Optimisation of the shot peening in terms of the fatigue resistance. in Shot Peening: Present and Future. The 7th Conference on Shot Peening (ICSP-7). Warsaw, Poland.: Institute of Precision Mechanics <IMP>.
2. Solis-Romero, J., E.R. de.los.Rios, A. Levers, and S. Karuppanan. (2001), Toward the optimisation of the shot peening process in terms of fatigue resistence of the 2024-T351 and 7150-T651 aluminium alloys. in Surface treatment V: Computer methods and experimental measurements for surface treatment effects. Spain: WIT press, Southampton, U.K.
3. E837-95, ASTM, (1995). Standard test method for determining residual stresses by the hole-drilling strain-gage method.Annual book of ASTM standards, American Society for Testing and Materials. Vol. 03.01., Philadelphia, PA 19103. p. 642-648
4. Handbook, ASM, (1996), Fatigue and Fracture. p. 231.
5. Airbus Industrie Material Specification, (AIMS 03-02-011), (1996), Aluminium Alloy (7150) Solution treated, controlled stretched and artificially aged (T651) plate., AIRBUS INDUSTRIE, Editor. Airbus industrie: Blagnac cedex, France. p. 1-6.
6. Wohlfahrt, H. (1984), The influence of peening conditions on the resulting distribution of residual stress. in Second International Conference on Shot Peening. Proceedings of the International Conference on Shot Peening (ICSP-2). Chicago: The american Shot Peening Society.
7. de.Rosset, W. and A.V. Granato, Strain rates in dislocation dynamics, in Fundamental aspects of dislocation theory,. 1970, National Bureau of standards special publication 317: Washington, D.C. p. 1099-1113.
For Information:
Jose Solis Romero (Ph.D.)
E-mail: josesolis@itesm.mx
MSc. Francisco Sandoval Palafox
E-mail: fsandova@itesm.mx
Ulises Figueroa López (Ph.D.)
E-mail: ufiguero@itesm.mx
Instituto Tecnológico y de Estudios Superiores de Monterrey (ITESM), campus Edo. de Méx., 52926, México
Instituto Tecnológico de Tlalnepantla,
Tlalnepantla Edo. de Méx., 54070


